On this page, you will find charts that show all of the data I collected from the surveys I conducted. Each chart represents a different question. The charts are as follows, in order from top to bottom:
- Number of hours spent with the sport
- Number of hours spent studying
- Name of sport
- Division of school
- Hours the participant lives away from home
- The participants year in school
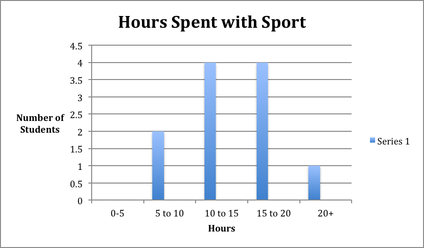
This chart represents the number of hours each student I surveyed spends with his/her sport each week. Being a student athlete, a good amount of each day is spent with some type of involvement with the sport. Most, but not all athletes spend more time with their sport each week than they do studying. This is why time management is such a huge deal to student athletes, even more than just students.
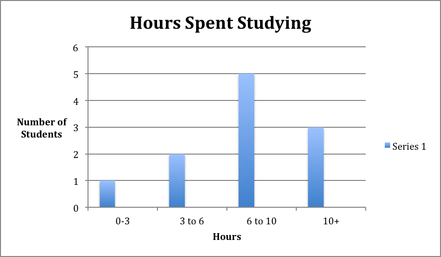
The number of hours spent a student athlete spends studying is majorly impacted by the number of hours they are committed to with their sport. The point of going to college is to get good grades and receive a degree, so finding time to study can be difficult but is important. In high school it was obvious that generally, boys who played sports did not always have the best grades and did not care as much to put effort into school. In college, that has changed completely. They have to have the grades in order to participate in sports. Male or female, the hours spent studying did not depend on the gender anymore.
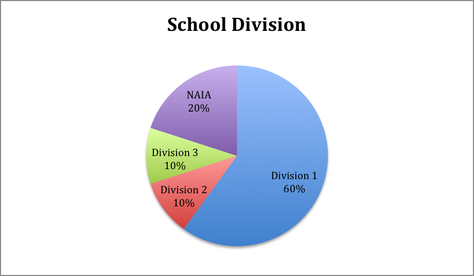
In the National College Athletic Association, there are 3 divisions. Division 1, Division 2, and Division 3. D1 sports are the most popular in the media, they are the sports that are seen on TV and the games that people make huge deals out of. There is one more division called the NAIA. This division is typically the division that smaller or private schools are a part of. In some cases, NAIA is considered D2. Divisions can also distinct the level of ability of athletes. This chart shows that out of those who took this survey, the majority of athletes are D1. Because D1 sports are more popular, they have a little more pressure on them because they know they are being watched every game or meet or at least more than other division schools.
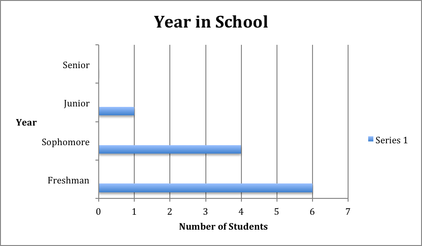
By seeing the year in school that my participants are in, you will be able to see how other statistics are based of how much experience they have had with balancing school and athletics. For example, freshman and maybe even sophomores are just getting used to dealing with the hectic schedule of school and their sport. Some adapt to it easily and they are able to stick with their sport for their entire college career. For others, they realize they can't handle everything on their plate and end up quitting to become more focused on school. This chart shows how difficult it can be to stick to the sport by having more freshman and sophomores involved in athletics than juniors and seniors.
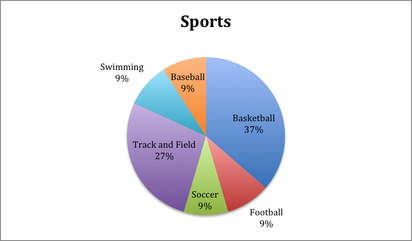
This chart gives you an idea of the types of athletes that participated in these surveys. Sports can be stereotypical based on which sport you play. Football and mens basketball have always been the most popular sports in the media and the sports that most people are interested in. Because those two are more popular, they are expected to perform better and put on a better show which can result from more hours of practice than other sports that are not as popular in the media.
